Infrastructure Topology & Monitoring Dashboard

OVERVIEW

NexusOS is a real time infrastructure monitoring platform built for DevOps and SRE teams who need full visibility across distributed systems. It unifies service topology mapping, incident management, database health tracking and traffic analysis into a single observability workspace replacing the fragmented tooling that slows down incident response.

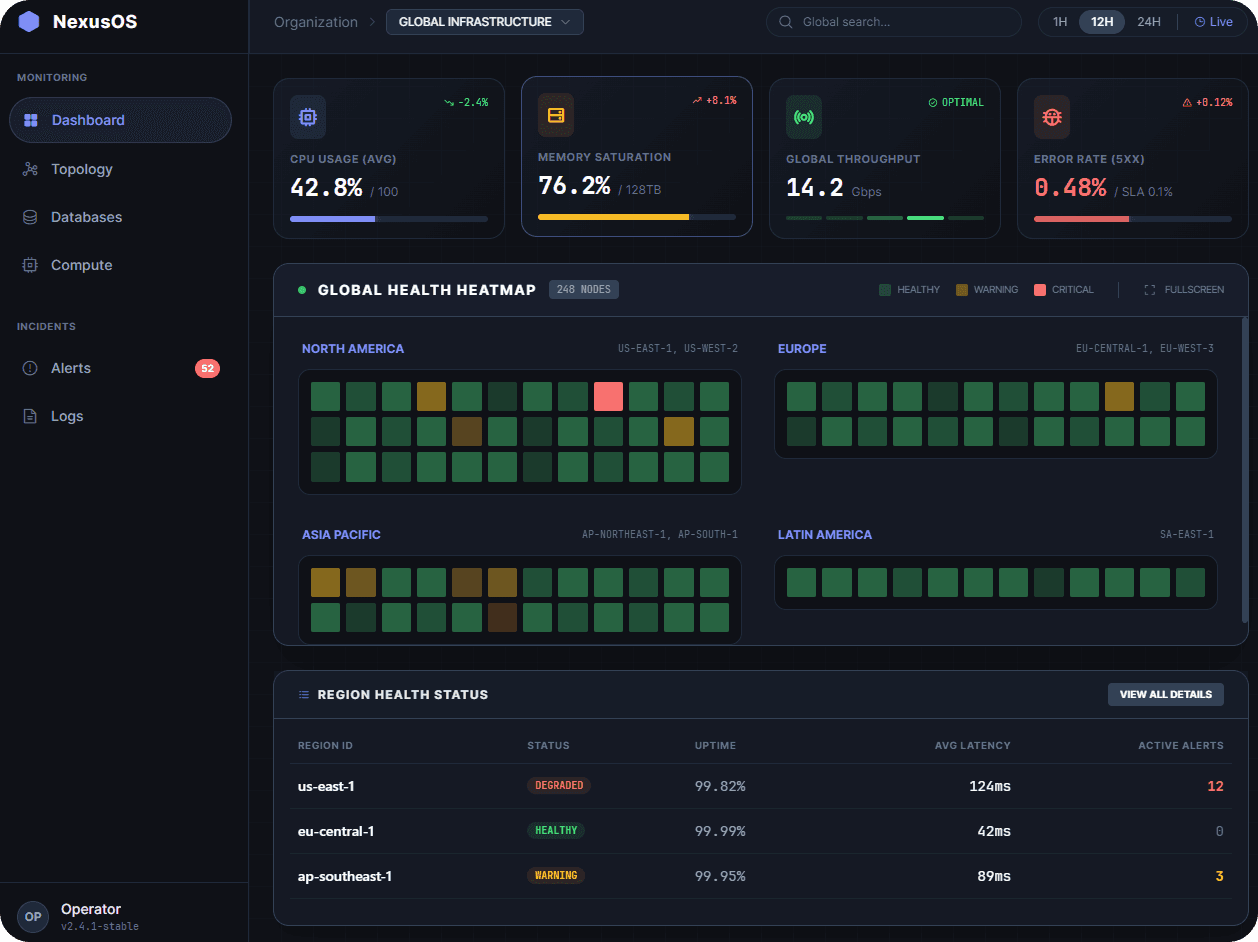
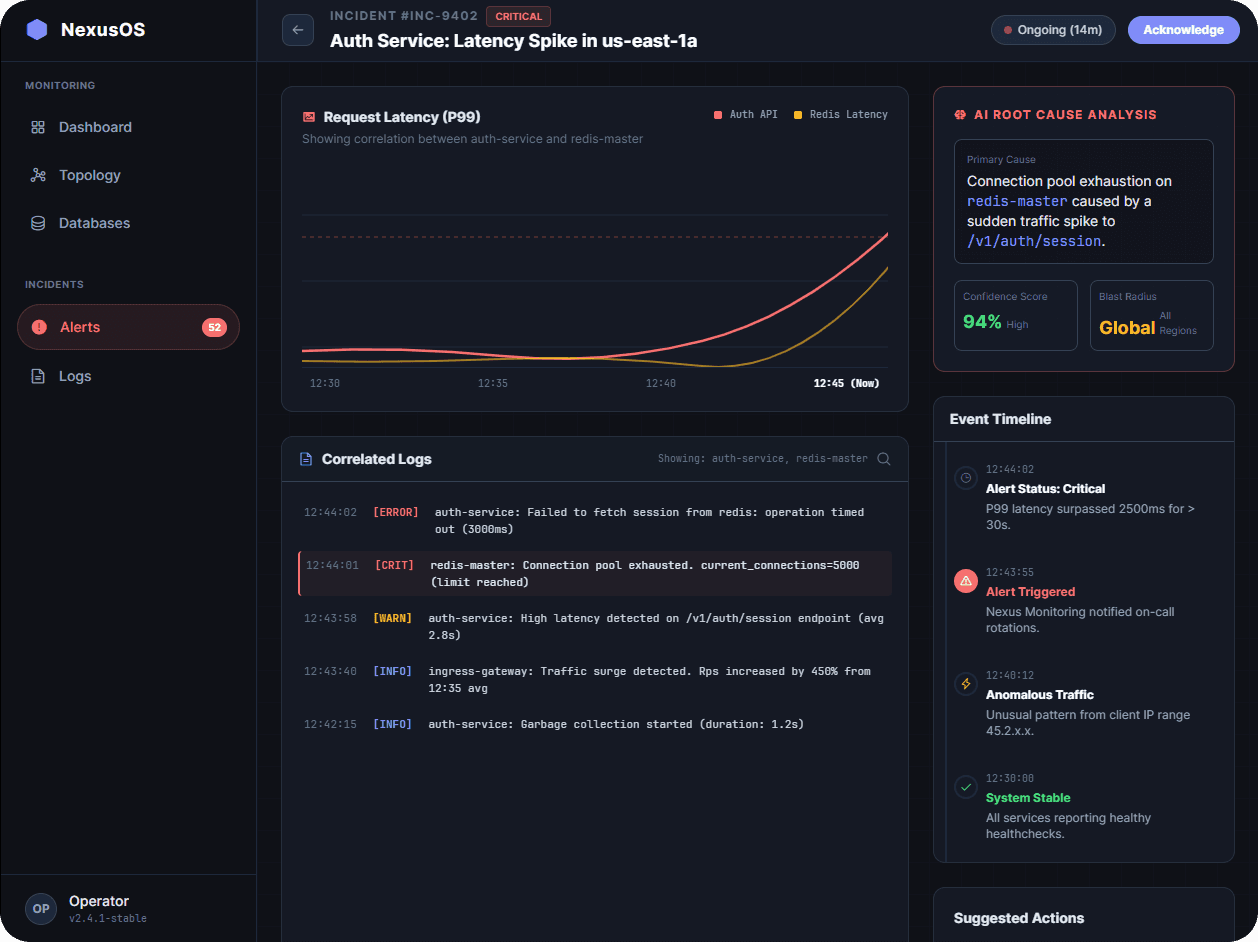
From AI powered root cause analysis to region-level health heatmaps, NexusOS helps teams detect issues faster, understand dependencies clearly and resolve incidents before they escalate.

The Problem

DevOps and SRE teams rely on a patchwork of disconnected monitoring tools to track infrastructure health. When incidents hit, engineers waste critical minutes jumping between dashboards, piecing together logs and manually correlating service dependencies slowing down response times and increasing the blast radius of outages.

The Solution

NexusOS unifies infrastructure monitoring into a single, real time platform. From a live topology map that visualizes service dependencies to AI powered root cause analysis that pinpoints failures in seconds teams get full observability across regions, databases and traffic flows without ever leaving one workspace.

User Flow

The experience starts at a global dashboard where operators see system wide health at a glance CPU, memory, throughput and error rates across all regions. From there, they can drill into a live topology map that visualizes how services connect, where traffic flows, and which nodes are degraded.


When an incident surfaces, the alerts inbox prioritizes issues by severity and a single click opens a detailed investigation view complete with correlated logs, latency charts, an event timeline and AI generated root cause analysis with confidence scoring and blast radius assessment.

Designing for High Stakes Speed

In incident response, every second matters. The information hierarchy had to prioritize actionable data first severity, blast radius, root cause and push supporting context one layer deeper without hiding it.

Making AI Trustworthy in Critical Moments

The AI root cause panel needed more than just a diagnosis. Adding a confidence score and blast radius indicator gave engineers the context to trust the suggestion or dig deeper without blind faith.

Density Without Chaos

Infrastructure dashboards are inherently data heavy. Using progressive disclosure high level heatmaps that expand into detailed tables kept the interface scannable at the top level and deep when operators needed it.

Smooth Scroll
This will hide itself!

Create a free website with Framer, the website builder loved by startups, designers and agencies.